

Inspect local log files
If you don’t want to run a terminal command liketail or tail the logs with Laravel Pail, you can use Herd’s integrated log viewer. It allows you to inspect your log files in great detail and makes searching through logs a breeze.
If you are only interested in the logs of the latest request, you may use the log view of Insights to get the most recent logs automatically.
This feature requires PHP 8.1 or later
herd logs in your project directory.
Herd watches your log files and shows new entries the moment they are written. The status bar at the bottom shows a green “Live” indicator while Herd follows the log file.
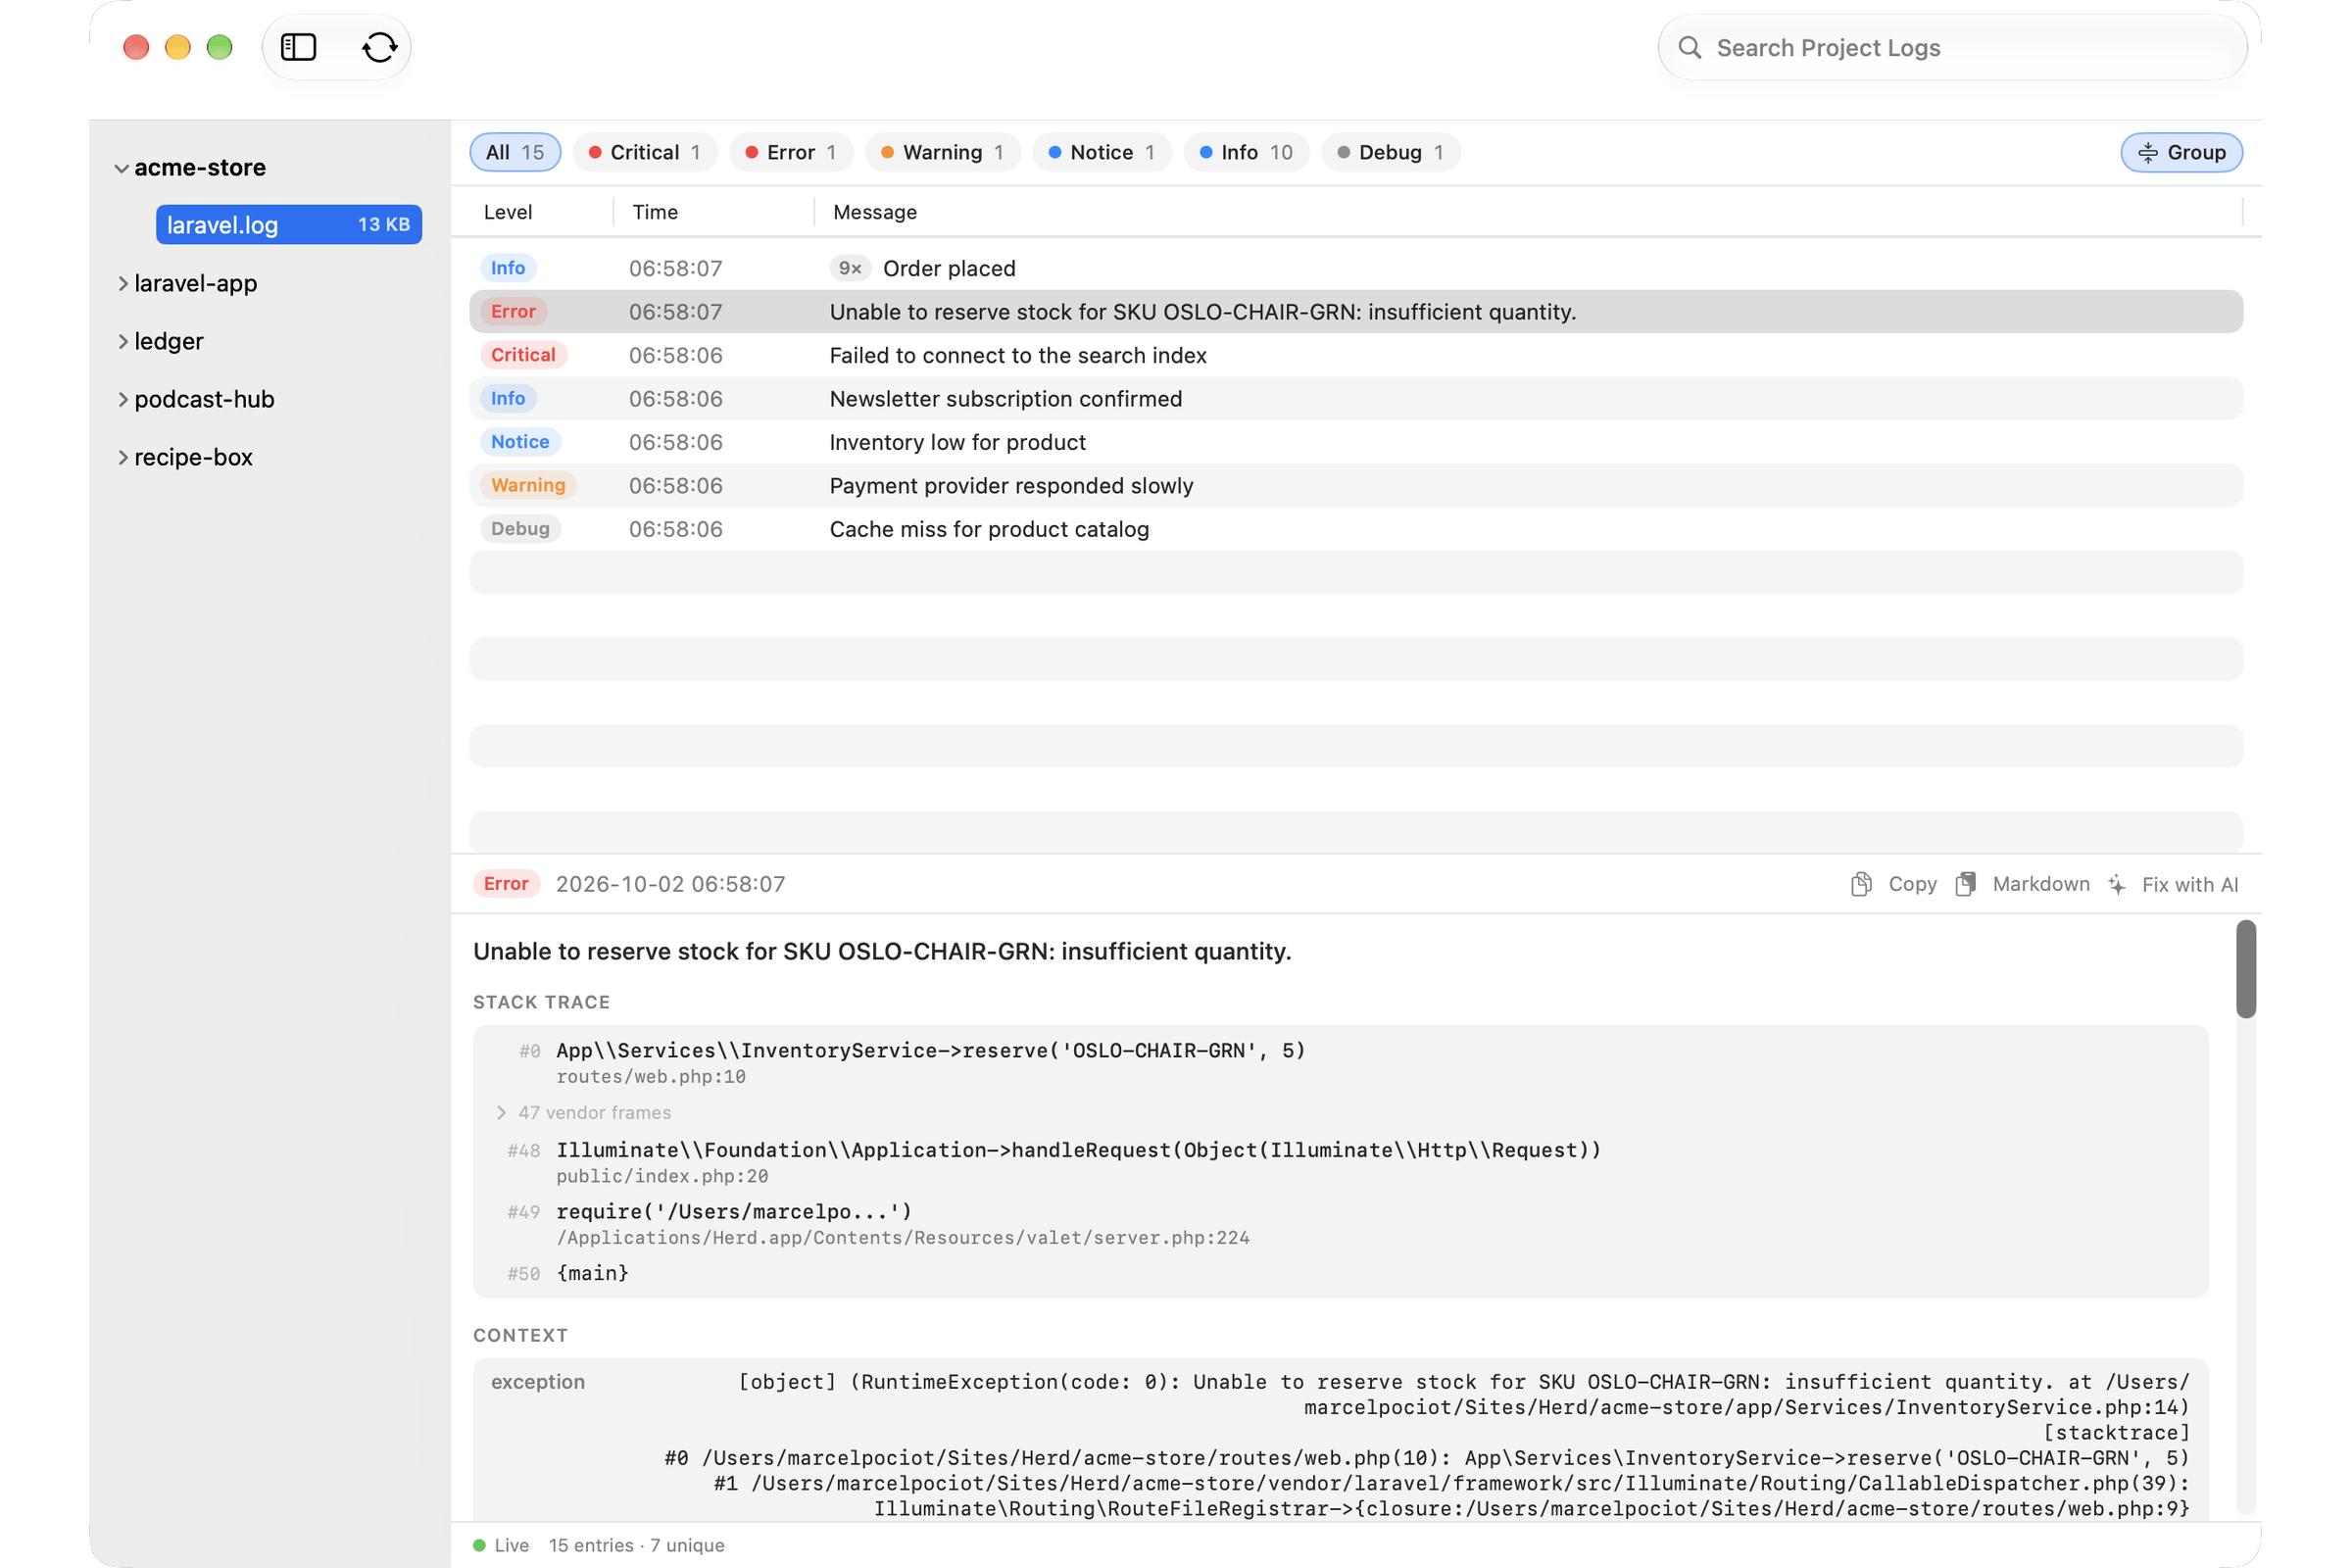
Selecting a Project and Log File
By default, the log window shows the latest log file of the last project that you visited in your browser. The sidebar lists all projects that Herd serves. Expand a project to see its log files and their sizes. If you have many projects, use the “Filter Sites” field at the bottom of the sidebar to find a project quickly. If a project has more than one log file, for example when using daily log rotation, select “All Files” to see the entries of all log files in one chronological timeline. You can delete a log file by right-clicking it in the sidebar.Filtering log entries
The bar above the log entries shows how many entries each log level has. Click one or more levels to only show entries of these levels. By default, Herd groups identical log entries into a single row and shows how often the entry occurred. You can turn this off with the “Group” button. If a log entry is not relevant for you, right-click it and select “Hide Entries Like This”. Herd hides all entries with the same message for this project and shows a chip for each hidden message in the filter bar. Click the chip to show these entries again.Searching in Log Files
The search bar at the top searches through all log files of the selected project and shows how many results it found in which files. If a log entry contains a request, trace or job ID in its context – likerequest_id, trace_id, correlation_id, job_id, batch_id or session_id – click the magnifier icon next to the value to find all entries with this ID across all log files of the project.
Inspecting log entries
Select an entry to see its details below the list. The detail view shows the message, the origin of an exception, the stack trace and the context of the entry. Click the origin or any frame of the stack trace to open the file in your editor. Herd collapses frames from your vendor directory to keep the stack trace readable. You can copy an entry as plain text or as Markdown. The Markdown version contains the message, stack trace and context, and is ready to paste into an AI agent. If Herd Studio is enabled, click “Fix with AI” to send the entry to a coding agent. The agent looks for the root cause in your codebase and fixes it while Herd opens Herd Studio for the project.Keyboard shortcuts
The Log Viewer supports keyboard navigation:Custom log paths
Herd looks for logs in the framework-specific standard directory, such asstorage/logs for Laravel. You can change that directory and even add multiple log directories by using a custom driver for that application.