Automatically use Xdebug
Herd Pro is able to detect Xdebug headers in HTTP requests or breakpoints in PHPStorm and routes these requests to a PHP process with Xdebug automatically. This keeps your site super fast on all normal requests but provides advanced debugging capabilities with Xdebug when needed.If Xdebug is too much for you and you prefer debugging via dumps, check out the Herd take on Dumps.
Setup with PhpStorm
Go to the debugging settings of Herd Pro and select the configuration to detect breakpoints within PhpStorm automatically.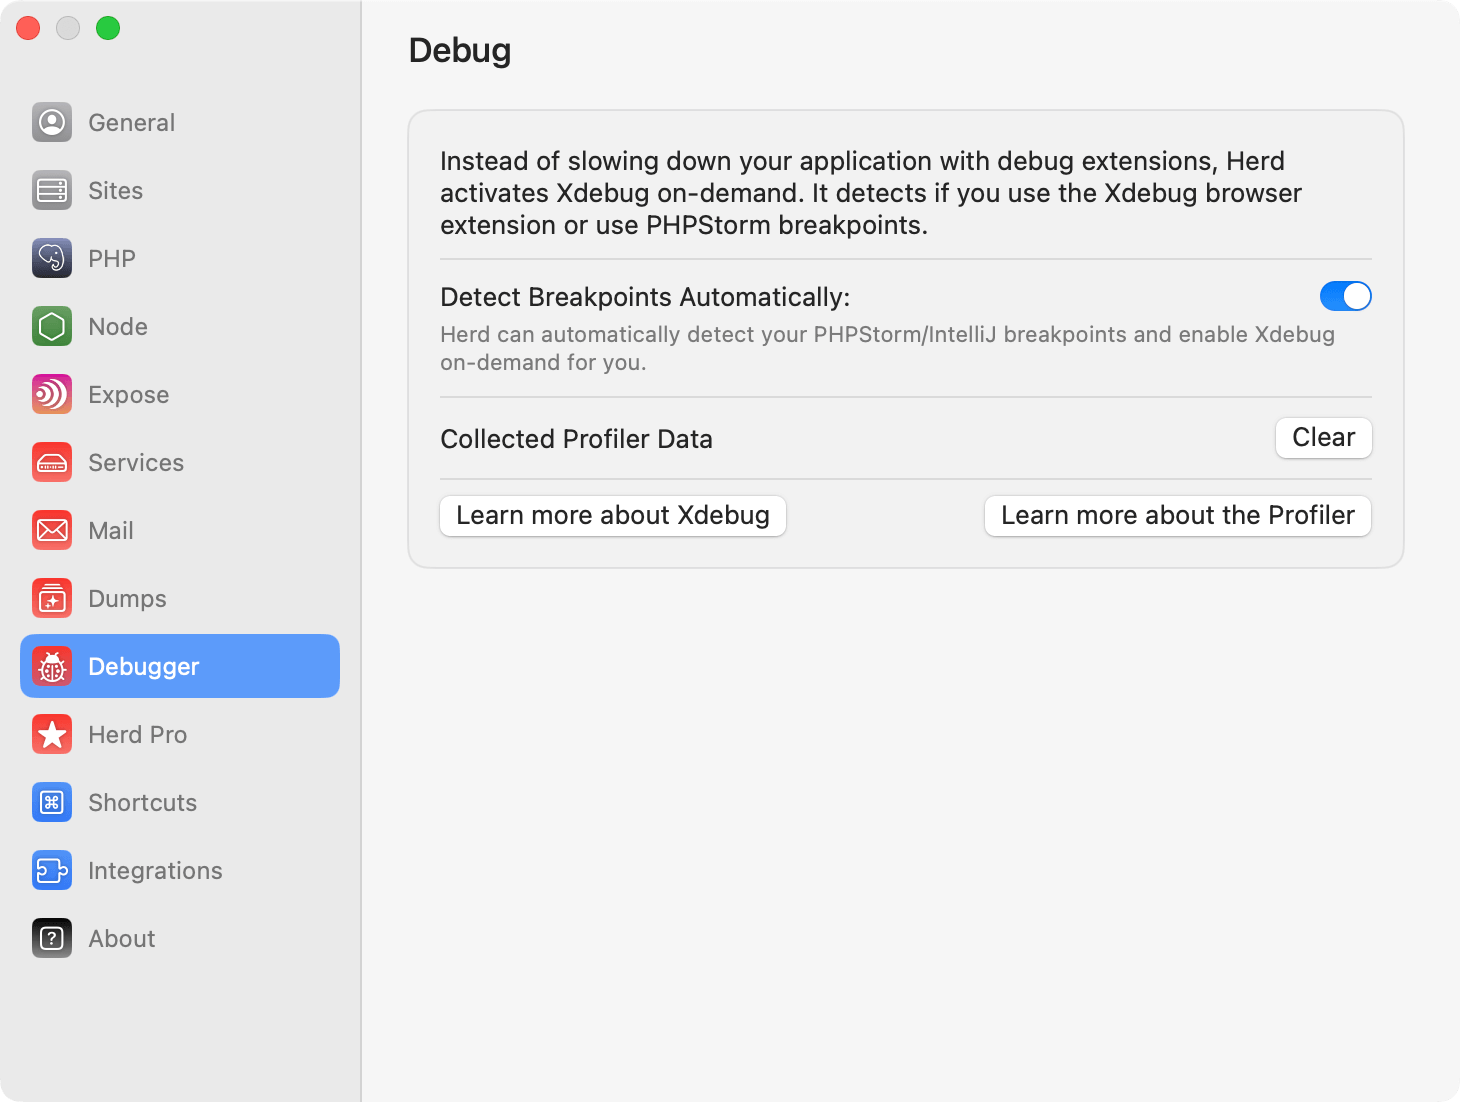
.idea folder of your project. Herd parses these files to detect breakpoints.
Please make sure to listen for PHP Debug Connections in PhpStorm after setting the breakpoint so that Xdebug can connect to PhpStorm properly.
Requirements for automatic detection
For the automatic breakpoint detection to work, these conditions must be met:- The
.ideafolder must be located directly in the site root directory — the folder that Herd serves. If your PhpStorm project root is a subdirectory (e.g.src/), the.ideafolder won’t be found by Herd. - PhpStorm must store breakpoints in
.idea/workspace.xml. Some newer PhpStorm versions may store breakpoints in separate files that Herd does not currently read.
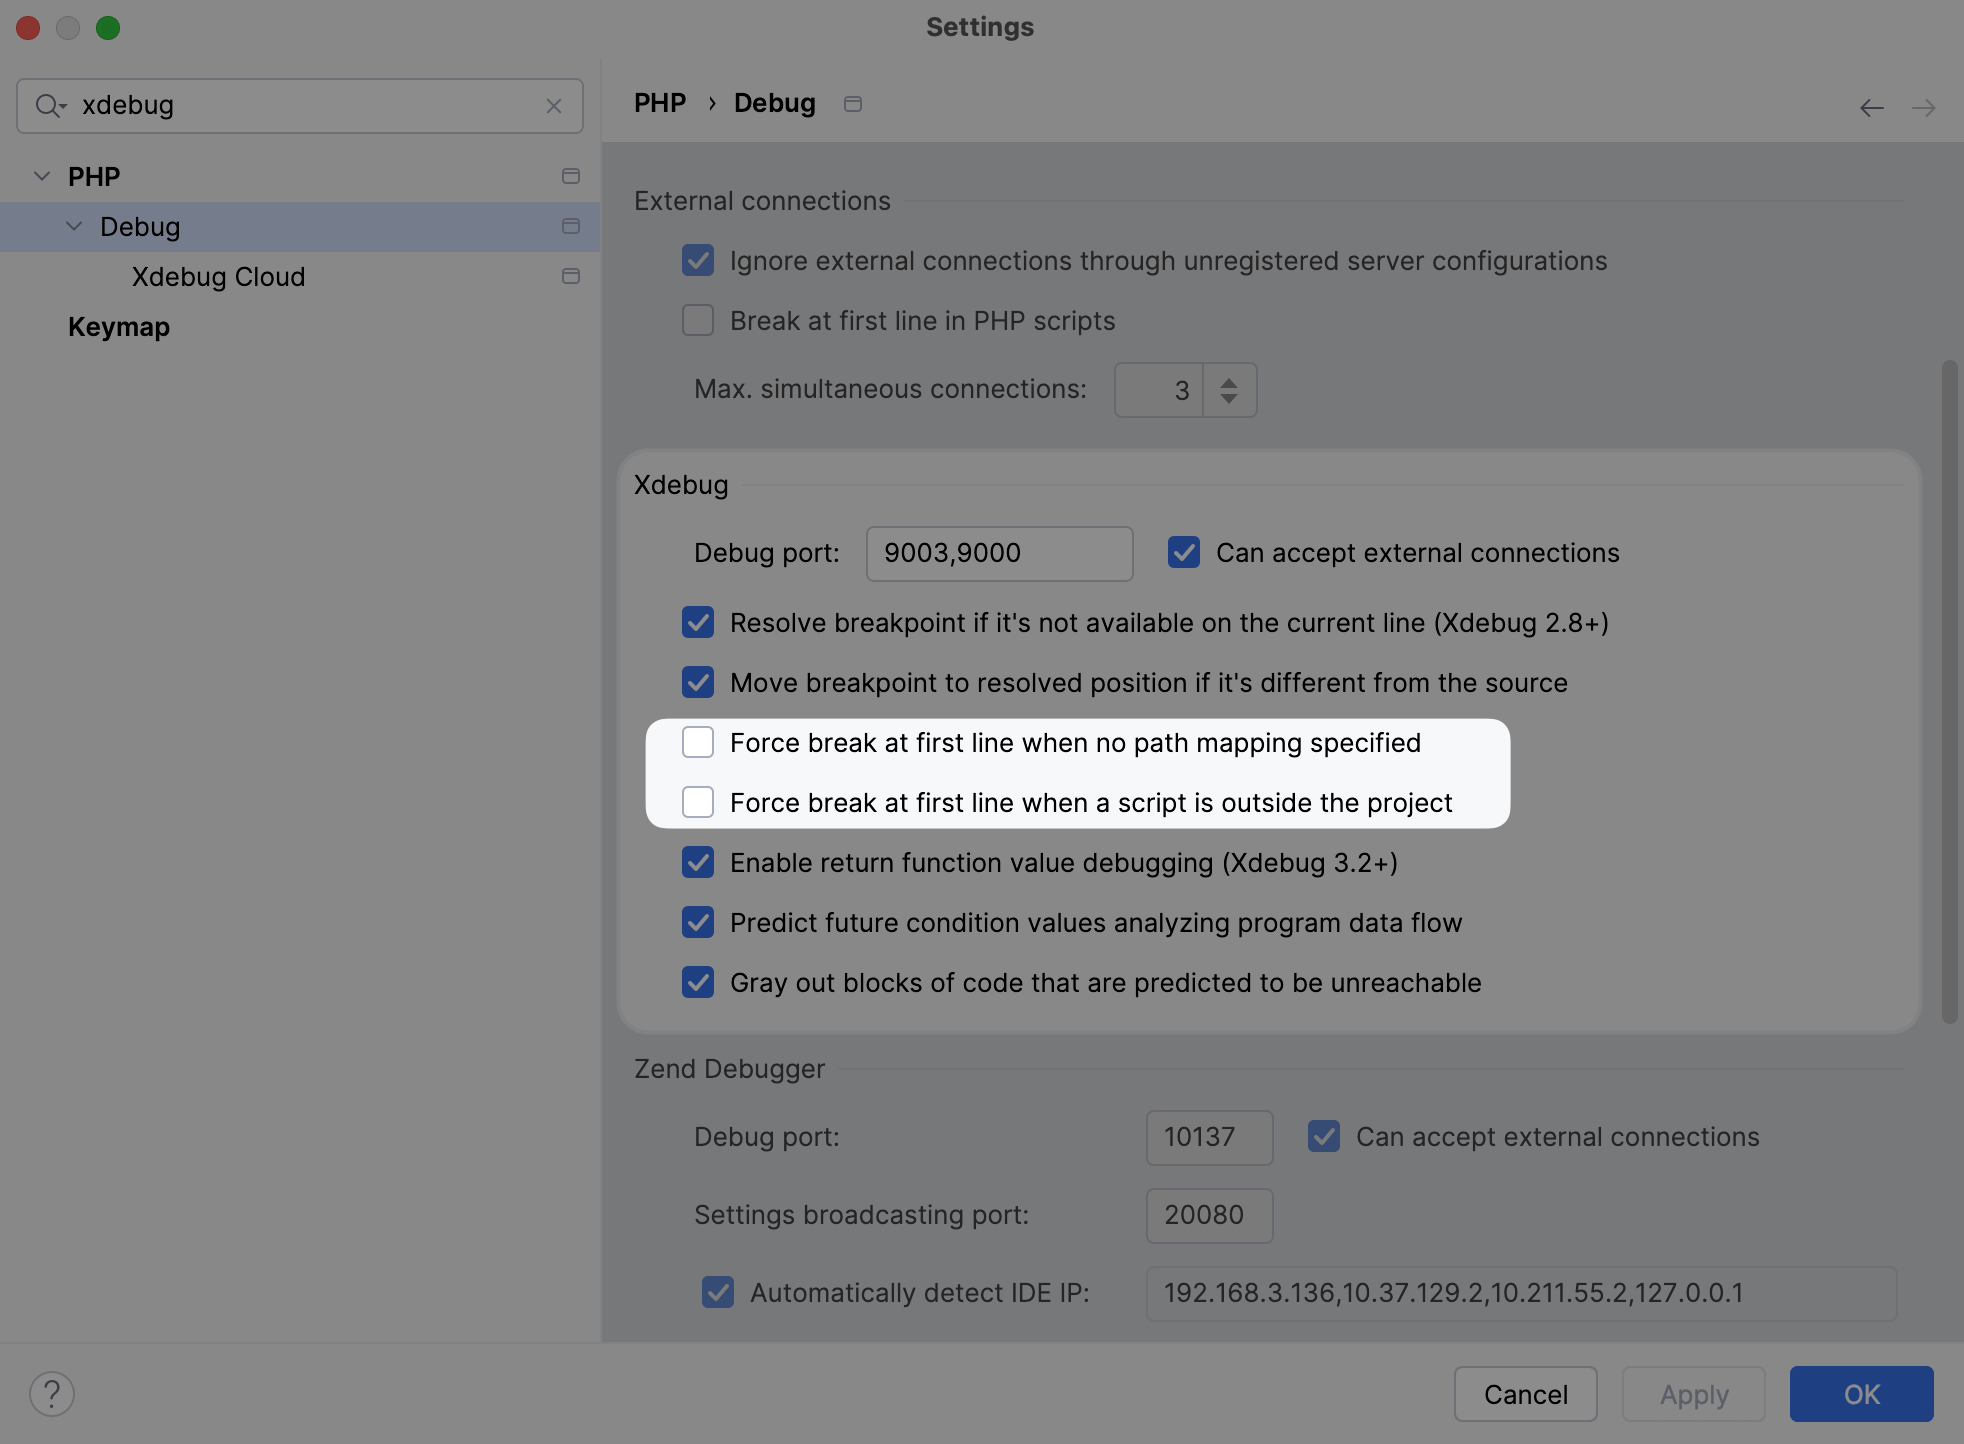
Configure PhpStorm to ignore the dump loader
Herd serves sites via a PHP script and if you’ve dumps enabled, it also uses adump-loader.php file for custom bootstrapping of your application. If you want to debug with Xdebug, it makes sense to configure PHPStorm to ignore this dump loader. You can do that in the settings of PhpStorm by unchecking the boxes for:
- Force break at first line when no path mapping specified
- Force break at first line when a script is outside the project
Setup with browser extensions
Herd uses the headers of Xdebug browser extensions that you can install via the Chrome Web Store or Firefox Addons. Once you enable the Xdebug feature in the browser extension, Herd serves the request via a PHP process with an enabled Xdebug extensions.Using Xdebug on the command line
You can run CLI commands viaherd debug .. instead of using php ... to use the php binary with Xdebug enabled. For example, if you are debugging an artisan command, you can run herd debug artisan your:command to trigger your breakpoint.
Code Coverage
Herd has acoverage command that allows you to run Xdebug’s coverage mode on your test suite:
Troubleshooting
If the automatic PhpStorm detection does not work:- Make sure to save the file after setting or removing a breakpoint.
- Verify that the
.ideafolder is located directly in the site root directory that Herd serves — not in a subdirectory. - Check that your breakpoints appear in
.idea/workspace.xml. You can verify this by searching for<breakpoint-manager>in that file after setting a breakpoint. - If your setup doesn’t meet these requirements, use the Xdebug browser extension as a reliable alternative.