Profiling Applications
Herd supports a customized version of the SPX profiler for PHP. The profiler allows you to identify bottlenecks in your application and supports profiling web and CLI requests.Installing the profiler extension
You can download and install the profiler extension by running this command in your terminal:php.ini files. If you install a new version, please run this command again to add it to this version automatically.
The extension does not profile requests automatically and requires environment variables or specific headers to record and profile the request, so you can keep it enabled without slowing down your normal setup.
Profiling Web Requests
You can either open the profiler dashboard from the site configuration of the Site Manager or by opening the/herd-profiler route of your application. This route is dynamically added to requests when you enable the profiler in the settings.
The Profiler Dashboard
Herd uses the SPX extension for PHP to profile your application and display a customized dashboard of your requests. Please make sure to enable the profiling on the top left.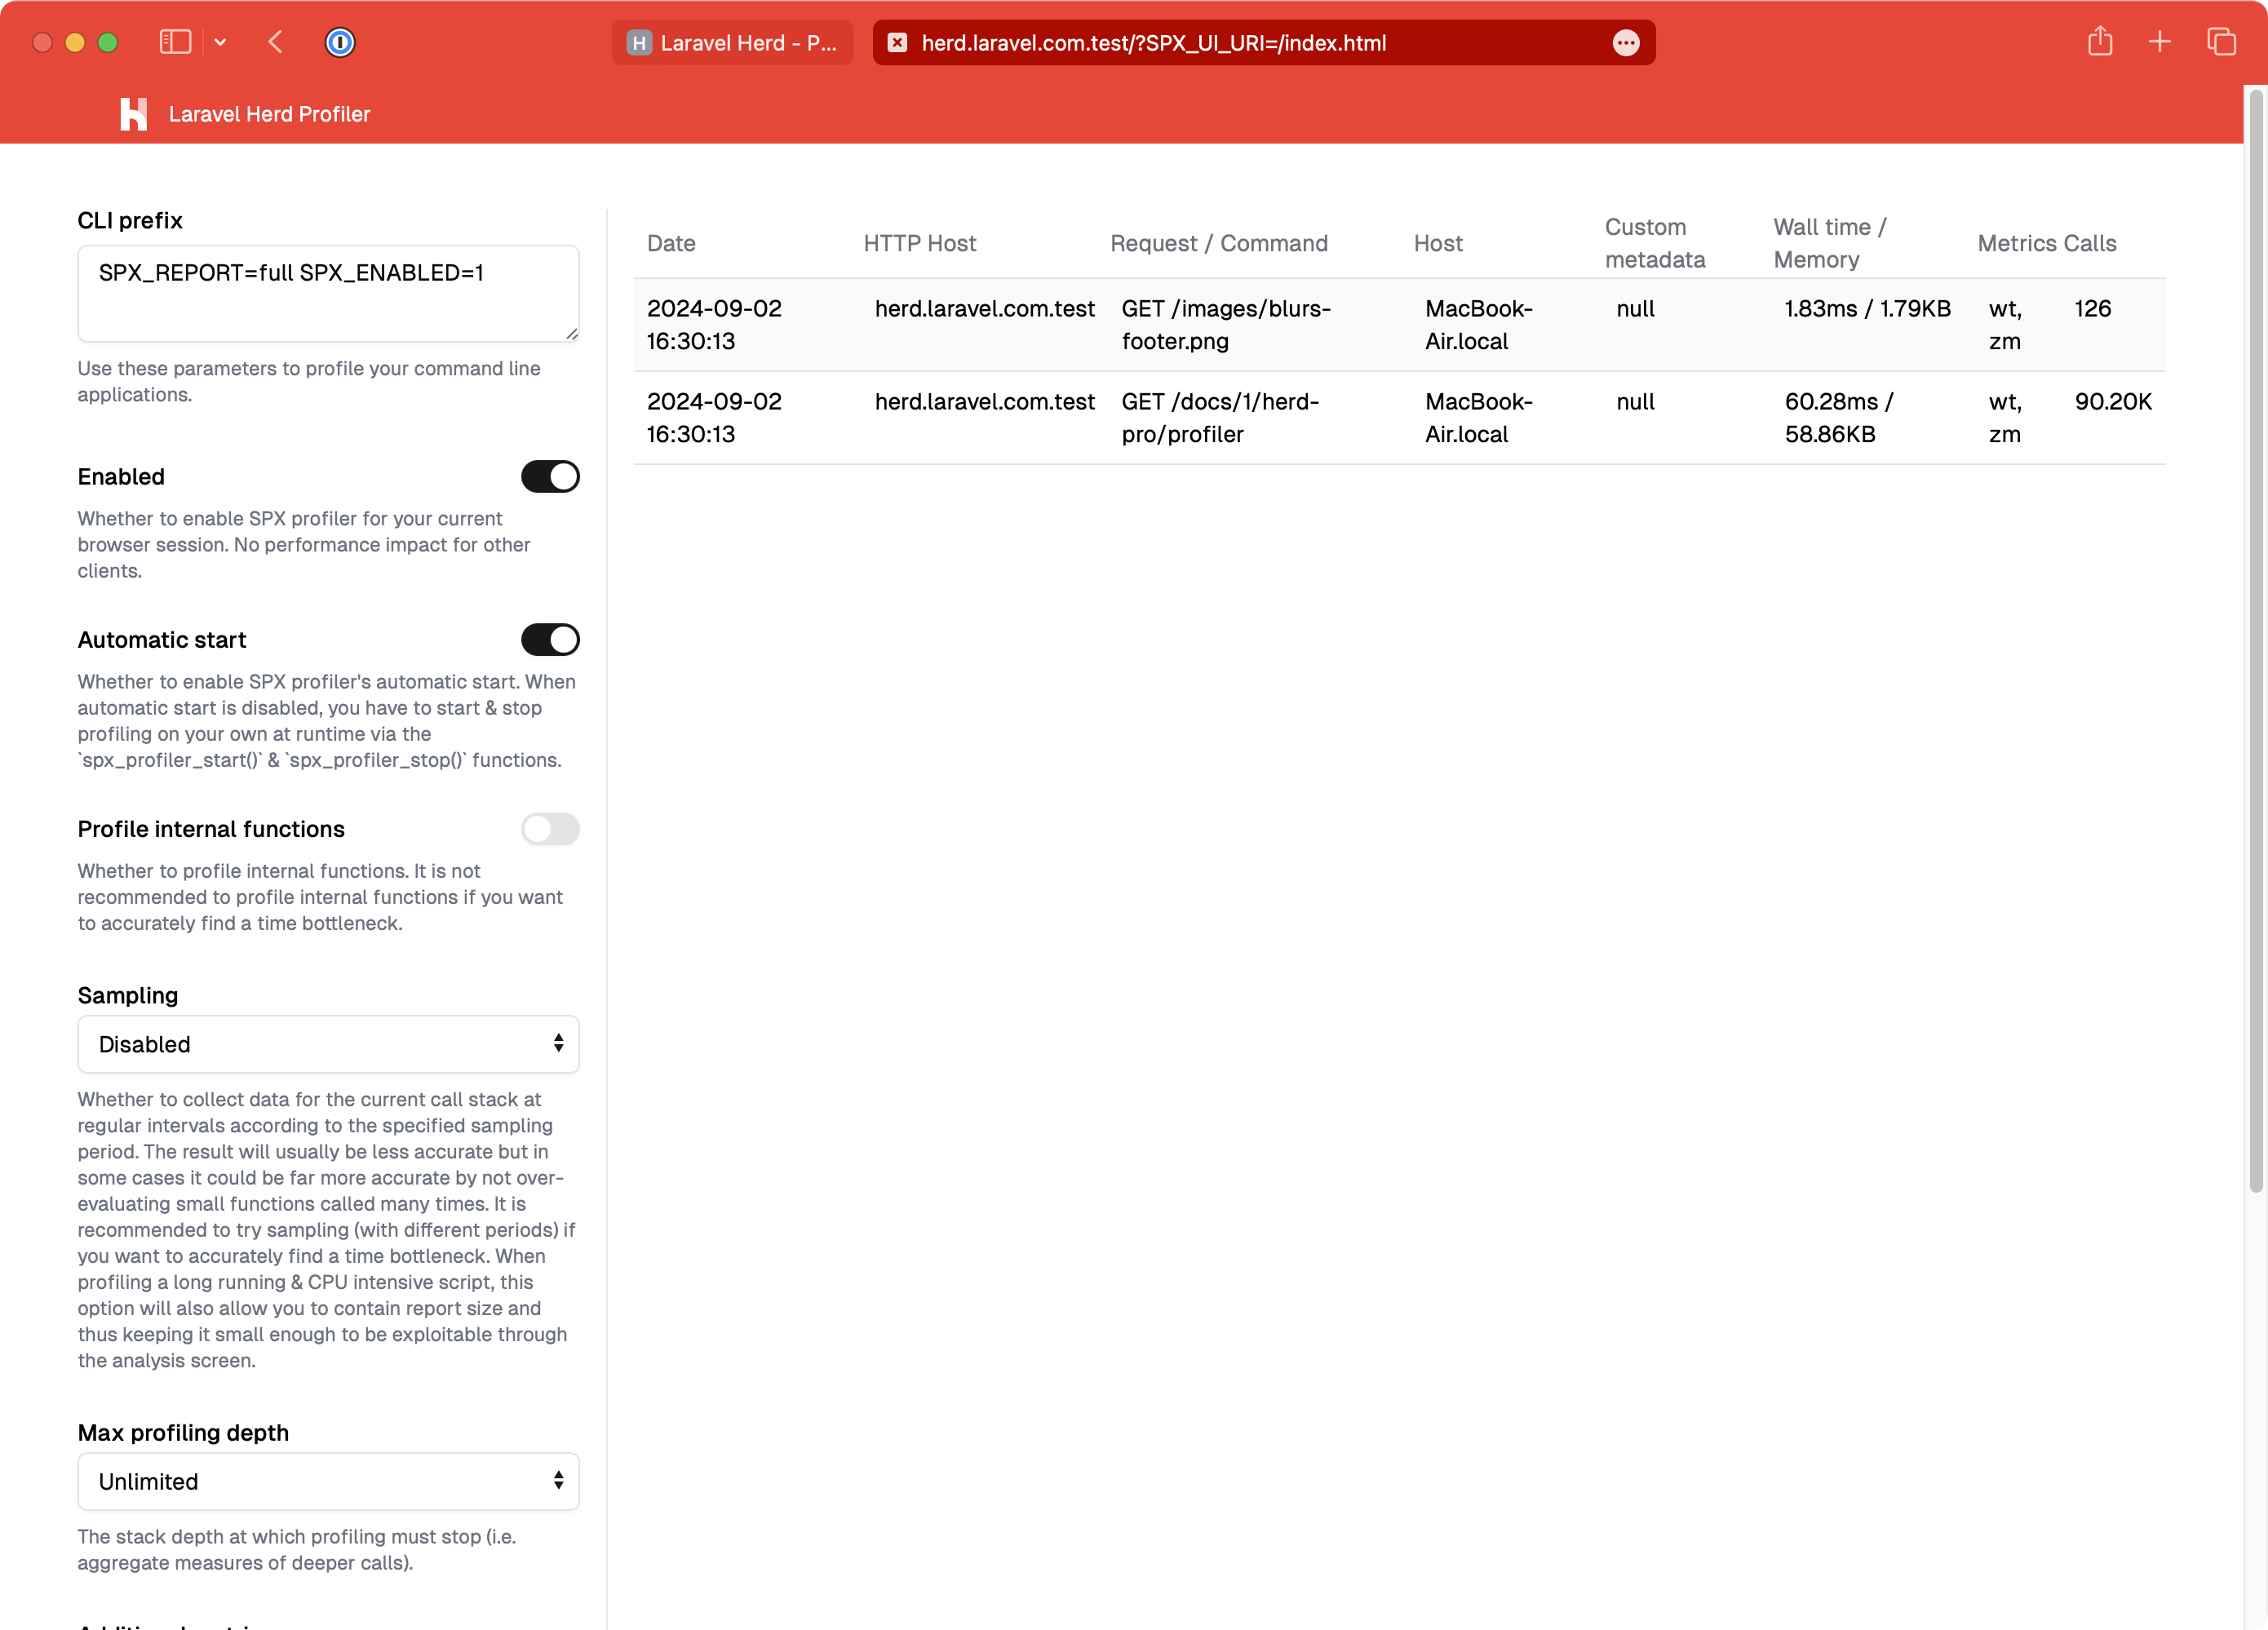
Results
If you click on a web request in the dashboard, it loads a breakdown of the request and allows you to inspect function calls and other operations in great detail.
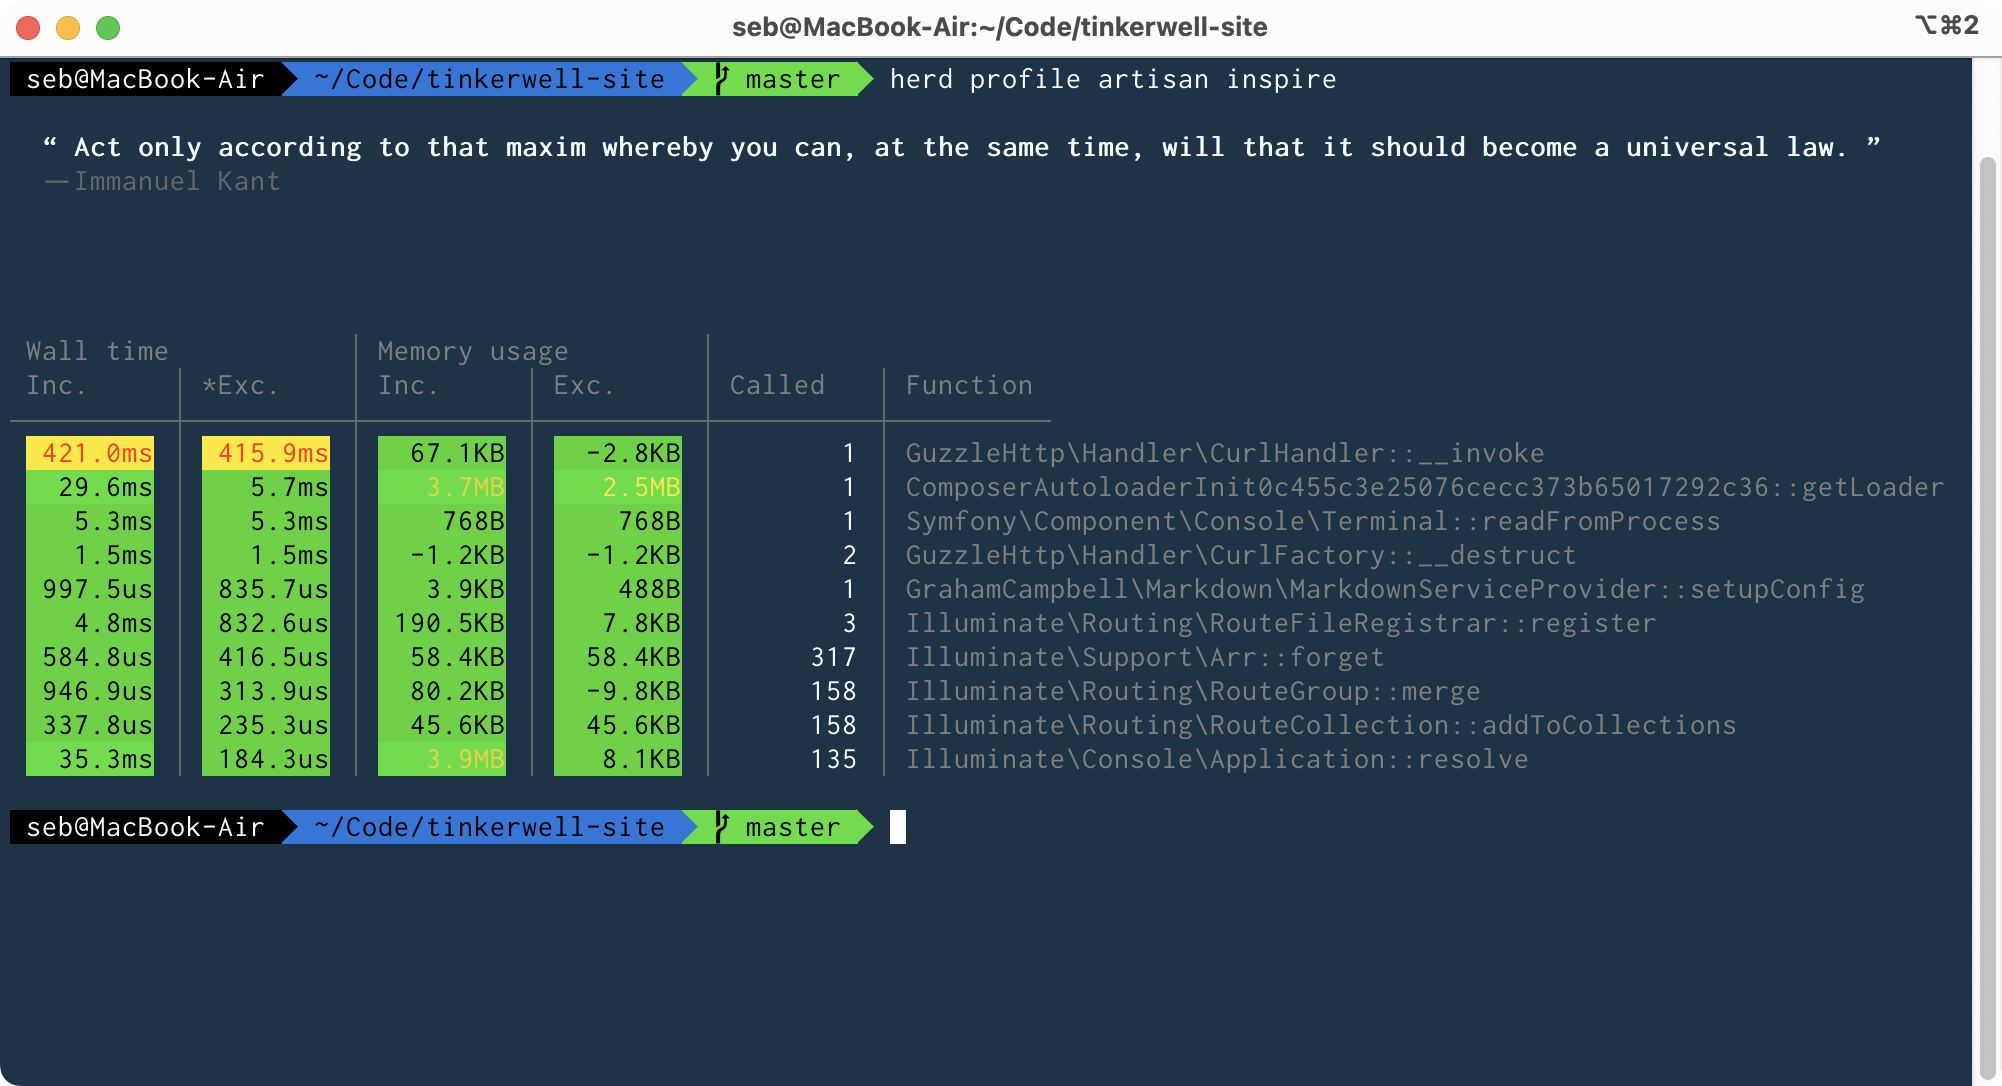
Profiling CLI scripts
While you can profile web requests via the dashboard, SPX has a profiler for CLI requests as well. When the SPX extension is active, you can run PHP scripts withherd profile to trigger the profiling process. As an example, you can profile artisan commands with this command: